Winter Virus Dashboards: A Population Compass, Not a Personal Diagnosis
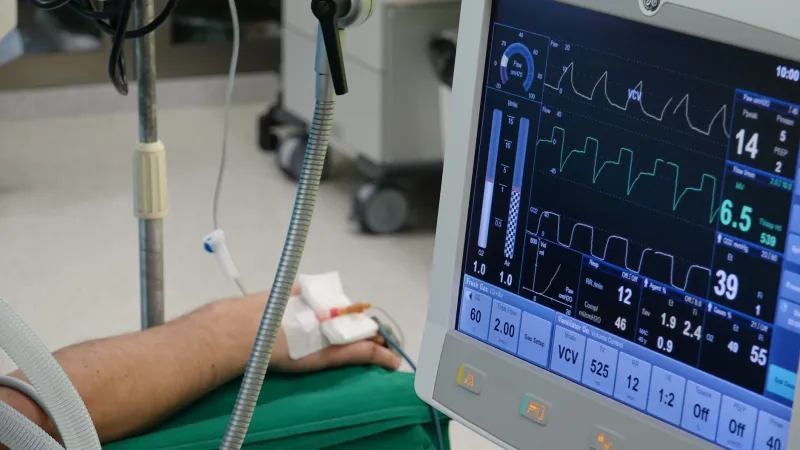
The dashboard is a weather map, not a forecast for your household
As the UK settles into the 2026–27 winter respiratory season, the familiar spreadsheets and online dashboards have returned. UKHSA publishes weekly surveillance on influenza, COVID-19, respiratory syncytial virus (RSV) and norovirus; NHS England releases winter operational data; integrated care systems and local public health teams add their own views. The volume of information can create an illusion of precision. In practice, these products are population tools. They help hospitals, GP practices and public health teams anticipate pressure, adjust infection prevention and plan vaccination messages. They do not tell an individual whether a sore throat is flu, whether a cough is COVID-19 or whether a sickness bug is norovirus.
That distinction matters most when people are deciding whether to contact their GP. A rising line on a national chart is not a reason to avoid care, and a flat line is not a reason to assume that a persistent symptom is unimportant. The dashboard describes the crowd. The consultation describes the person.
What the main winter indicators actually measure
Influenza figures usually combine laboratory positivity, hospital admissions and consultation rates. COVID-19 surveillance now relies more heavily on sentinel testing, hospital data and wastewater signals than on mass community testing. RSV reporting draws on laboratory confirmations and paediatric hospital activity, while norovirus data often reflect laboratory reports and outbreak notifications rather than every case in the community. Each stream has a different denominator, a different lag and a different sensitivity to testing behaviour.
This is why a single week’s jump should be treated cautiously. A rise in flu positivity may reflect genuine transmission, but it may also reflect increased testing after a bank holiday or a change in who is being sampled. Norovirus reports can rise when outbreak reporting improves. COVID-19 hospital numbers can be affected by admission testing policies. Local dashboards may be more granular, but they are also more prone to small-number instability. A cluster in one town does not automatically mean the same risk in the next county.
For clinicians, the practical value lies in direction and context: is influenza increasing earlier than usual, are RSV admissions affecting paediatric capacity, is norovirus affecting care homes, and are staff absences changing appointment availability? For patients, the value is broader still: it can explain why a practice is triaging more calls, why face-to-face slots are under pressure or why infection control measures have changed.
Flu, COVID-19, RSV and norovirus are not interchangeable
Winter viruses are often discussed as a single wave, but they behave differently. Influenza can rise sharply and affects older adults, pregnant women, young children and people with long-term conditions disproportionately. COVID-19 continues to cause hospital admissions, particularly among older and immunosuppressed people, but population immunity and testing patterns have changed its visible footprint. RSV is a major cause of infant bronchiolitis and can also affect older adults; the UK’s maternal and older adult vaccination programmes are part of the 2026–27 prevention picture. Norovirus is not a respiratory virus, but it places significant pressure on hospitals, care homes and primary care through outbreaks and staff absence.
A dashboard that aggregates these signals into a single “winter virus” index can obscure more than it reveals. A practice seeing more toddler bronchiolitis has a different clinical problem from one seeing more norovirus in a care home. Patients should also be wary of interpreting a national rise in one virus as proof that their own symptoms are caused by it. Symptoms overlap, and testing is not routine for every respiratory illness.
Population trends and individual risk use different evidence
Individual risk depends on age, pregnancy, immunosuppression, chronic heart or lung disease, diabetes, vaccination status, recent exposure and the course of symptoms. A population dashboard cannot incorporate those factors. It also cannot assess severity. A high number of mild infections in younger adults is not equivalent to a smaller number of severe infections in older people.
This has a direct consequence for appointment behaviour. People should not cancel a needed review because national figures look busy, nor should they assume that a low dashboard count means a persistent cough or fever can wait indefinitely. NHS 111, urgent treatment centres and emergency services remain appropriate for severe symptoms such as breathing difficulty, chest pain, confusion, dehydration or a non-blanching rash. For less urgent concerns, a GP practice can advise on triage and timing.
Practical questions when booking or attending
Patients can make better use of a GP appointment by asking focused questions:
- Is this appointment likely to be telephone, video or face-to-face, and what symptoms should I mention when booking?
- Does the practice want me to take a lateral flow test before attending if I have respiratory symptoms?
- Are there separate arrangements for suspected norovirus, such as avoiding the waiting room and phoning ahead?
- Given my age, pregnancy status or long-term conditions, am I eligible for flu, COVID-19 or RSV vaccination?
- If my symptoms change or worsen, what should I do and where should I go?
Clinicians may also find it useful to explain that local dashboards inform staffing and infection control rather than individual diagnosis. That transparency can reduce the sense that data are being used arbitrarily to restrict access.
Reading the signal without overreading it
The strongest use of winter dashboards is as a shared language for system pressure. They can prompt earlier vaccination reminders, outbreak planning and sensible triage. They cannot replace clinical assessment. At Sarissa Biomedical, the editorial principle is to translate biomedical evidence without inflating its certainty. The same discipline applies here: a dashboard is a compass for the population, not a diagnosis for the individual. The useful question is not what the national curve says about your cough, but whether your symptoms, history and circumstances warrant advice from a clinician.